Overview of the Interface
Project Sidebar
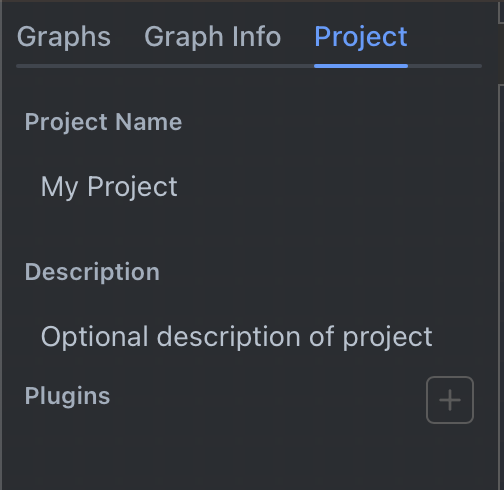
Project Settings
Use Project settings at the top of the graph tree panel to set the name and description of your project. This data is saved with your project file and used for documenting your project.
Project plugin declarations are shown separately as "Plugins used by this project". In Rivet 2, plugins are installed into the app from Settings > Plugins, and the project list is derived from actual plugin-node usage. See the Plugins documentation for more information.
Graph Tree
The graph tree is where you can navigate between all graphs in your project, filter graph names, add new graphs, and delete/duplicate existing graphs.
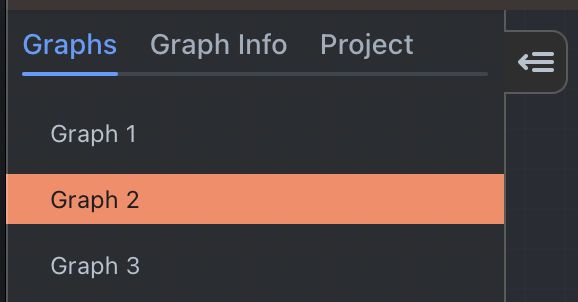
Clicking on a graph in the list will open it in the main graph area. To add a new graph, right click in the blank space in the graph list and select "New Graph".
To delete a graph, right click on it and select "Delete". This will delete the graph from your project.
There is no undo at this time! Deleting a graph is permanent! We recommend you store your rivet project files in source control.
To duplicate a graph, right click on it and select "Duplicate Graph". This will create a new graph with the same nodes and connections as the original graph.
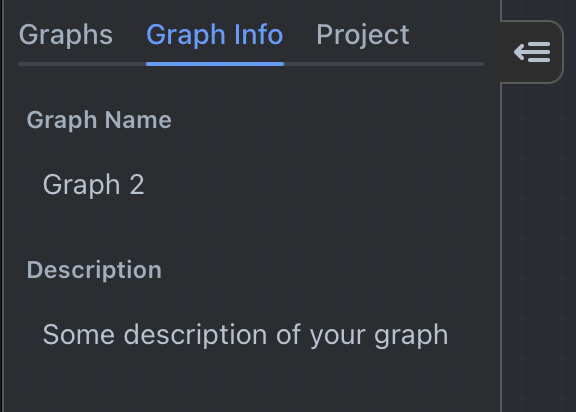
Graph Info
Right click a graph in the graph tree and choose Graph info to set the name and description of your graph. This data is saved with your project file and used for documenting your graph and organizing your graphs in the graph list.
Graph
You will mainly be working in the Graph area of the interface. It contains all of your nodes in the current graph and the connections between them.
Nodes
For information on how to manipulate nodes, see Working with Nodes.
Canvas
The canvas is the main area of the graph. You can click and drag on the canvas to move the graph around. You can also use the scroll wheel to zoom in and out.
Right click to open the context menu to add new nodes.
Hold shift and drag to create a selection box. Any nodes inside the selection box will be selected. You can then move all of the selected nodes as a group, or create a subgraph from the selected nodes. You can also hold shift and click the title bar of a node to add it to the selection.
Node Editor
The node editor is visible when you click the edit node icon on a node. It is used to edit the data on the node.
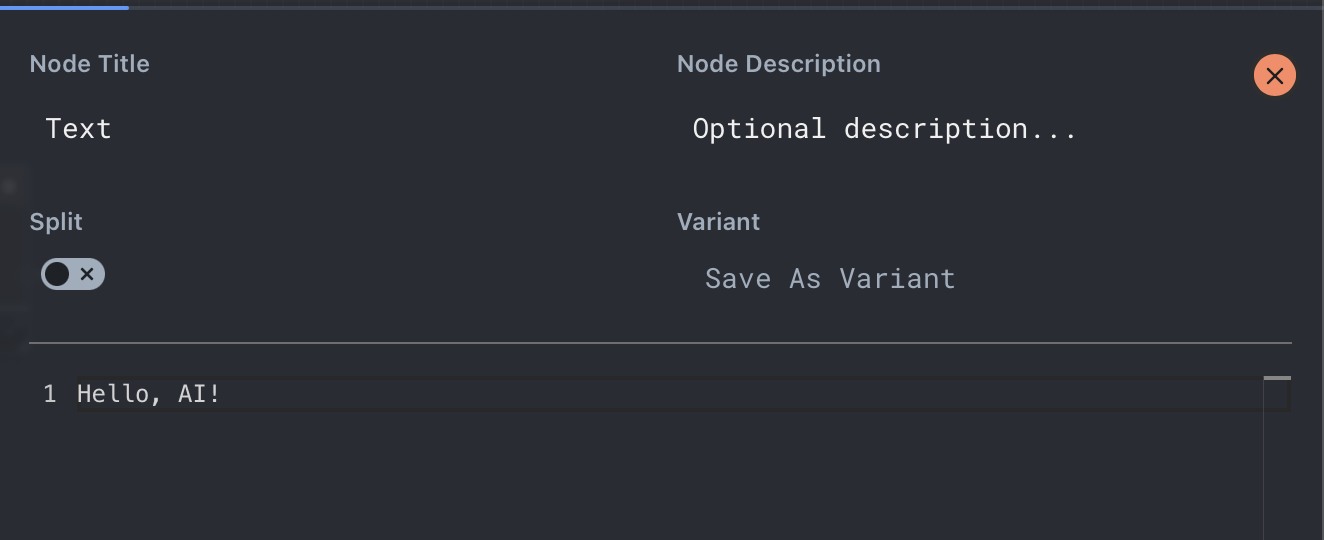
You can close the node editor by clicking the close button in the top right, by pressing the escape key, or by clicking on any blank space in the graph.
Node Title & Description
You can edit the title of the node in the node editor (changes the title shown on the graph). You can also edit the description of the node in the node editor, for documentation purposes.
Run Mode
The run-mode control decides whether the selected node runs once or runs over many input items. For more information, see the Running Many Items documentation.
When Many parallel runs or Many sequential runs is enabled, the settings underneath the run-mode control limit how many items can run and, for parallel mode, how many item runs can be active at once.
Variants
Variants are used to create multiple versions of the same node. The button on the right allows you to save the current node configuration as a new variant. The dropdown on the left allows you to apply existing variants to the current data on the node.
Variants allow you to save slight differences to a node, and test them without losing the data. For example, you may have a Text Node with a message to an LLM. You may want to test different variations of the message to see which one performs better and gives better AI results.
Node Data Editor
This area contains the editors for the currently selected node. The editor will change depending on the type of node you are editing. For example, the shown Text Node has a text editor, and the LLM Chat Node has provider, model, reasoning, response-format, tools, and technical-details sections.
Workspaces
The top app bar contains workspace tabs. Canvas is the normal graph-editing workspace. Other workspaces, such as Trivet Tests, Chat Viewer, and Data Studio, open full-screen workspace views. When no project is open, the top bar shows a Welcome screen tab so you can return to the centered welcome screen after opening a project-independent workspace. Run/debug controls are shown only while Canvas is active.
Prompt Designer
The prompt designer allows you to tweak an individual prompt to get the output you are looking for. It is opened from a Chat or LLM Chat node's flask icon, and Rivet shows a top-bar tab for it only while it is open. See the Prompt Designer documentation for more information.
Trivet Tests
Trivet allows you to set up test suites and test cases for your project. See the Trivet documentation for more information.
Chat Viewer
The chat viewer gives you a full-screen view of Chat and LLM Chat nodes that have produced chat content. Its top-bar tab appears only when there is something to view.
This view can give you a quick overview of how your AI is performing, and what it is doing at any given time. It can also be used to debug issues with your AI.
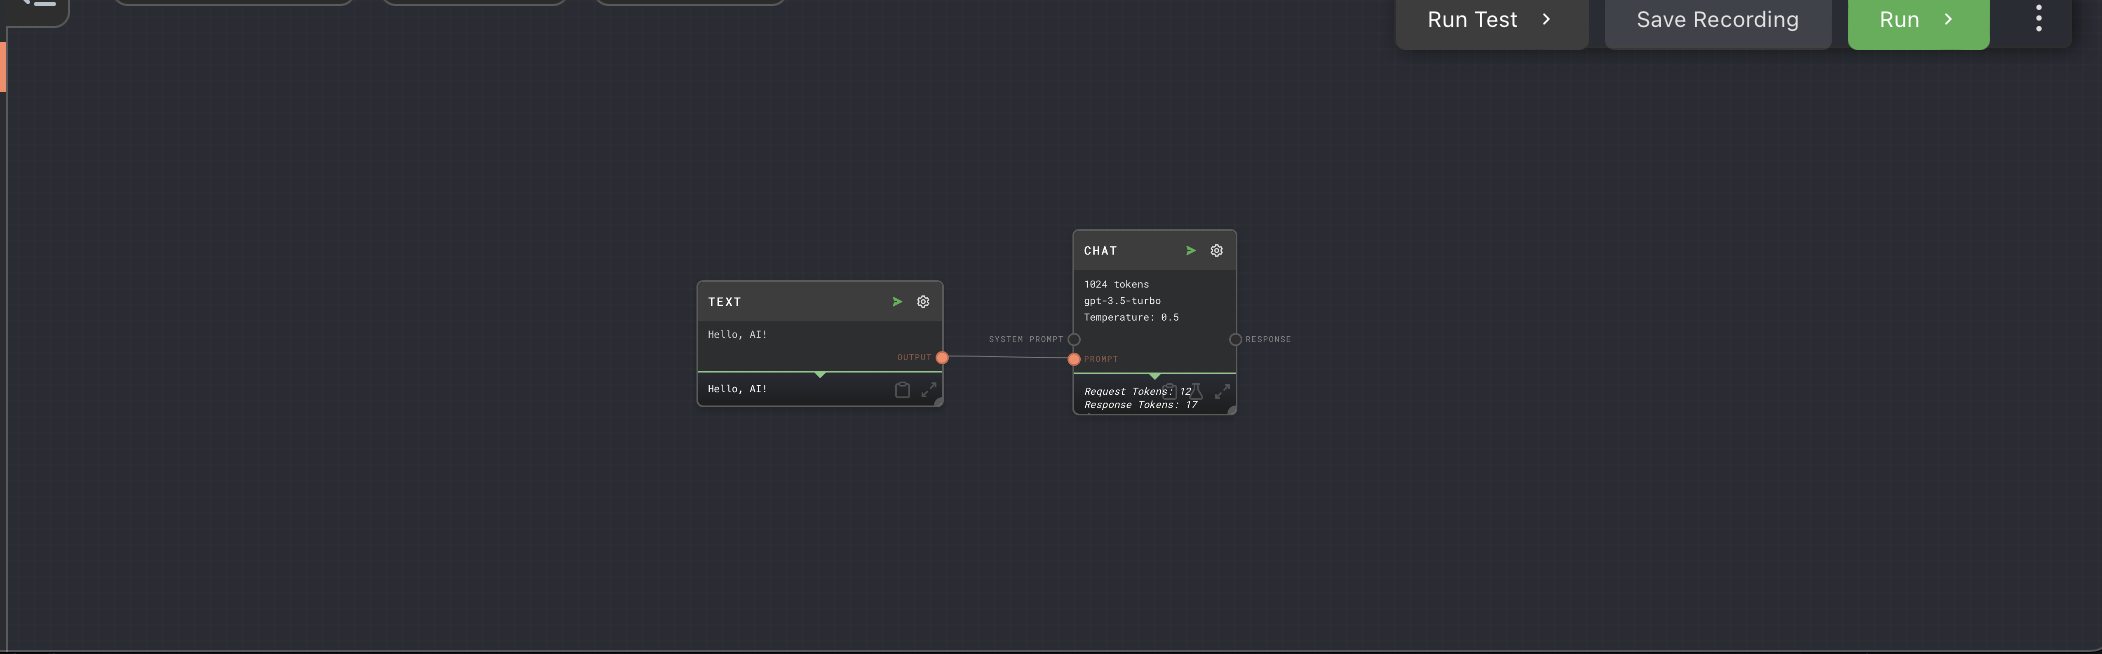
Action Bar
The action bar is in the top-right of the Canvas workspace. It contains buttons for running, pausing, aborting, and debugger-related actions for the current graph, plus the Run context menu.
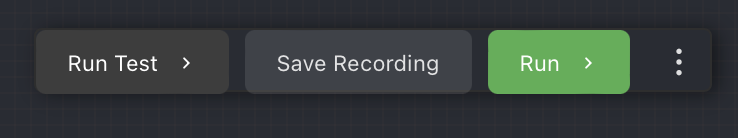
Run
Clicking the run button will run the current graph.
Abort
Visible while a graph is running. Clicking the abort button will abort the current graph.
Pause/Resume
Visible while a graph is running. Clicking the pause button will pause the current graph, and clicking the resume button will resume the current graph from where it was paused.
Menu
Access run-related options by clicking the menu '...' button next to the run controls. App-level settings are available from the app menu.