Simple Graph
In the sidebar you should see the graphs tab with a list of numbered folders with graphs. These are the graphs that are included in the tutorial project.
Inside the 1. Simple Graph folder you should see a Simple Graph graph. Click on the graph to open it.
You should see the following graph:
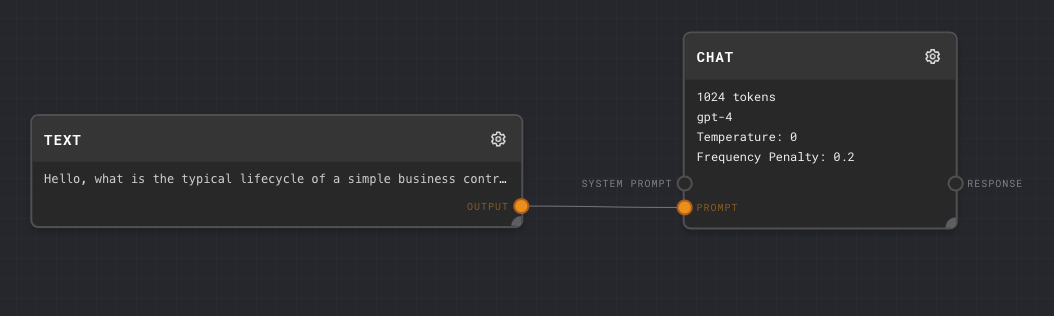
This graph has 2 nodes: a Text node and the legacy Chat node that ships in the tutorial project. For new Rivet 2 graphs, prefer LLM Chat.
Click the green run button in the top right corner of the graph to run this graph.
![]()
You should see something similar to the following:
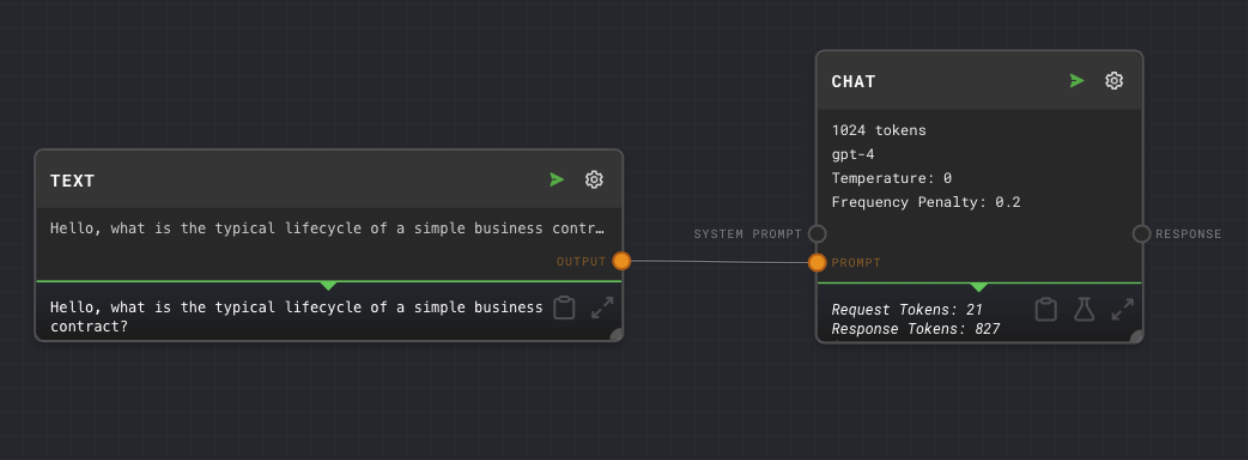
When you ran the graph, the Text node sent its output to the prompt of the Chat node. The Chat node then sent a provider request and received a response. The response was then sent to the output of the graph.
Let's experiment with the nodes in this graph. To change the parameters of a node, click on the edit gear in the top right on the node.
Experiments
Change the Text node to ask a new question like "What's the difference between a NDA and a MNDA". Run the graph again and observe the Chat node respond with new text.
Change the Chat node's max tokens to 256. Run the graph again and observe the Chat node respond with less text.
Change the Chat node's temperature to 1. Run the graph again and observe the Chat node respond with more variable text.